A plain guide to reading classic chart patterns on real prices.
Each page takes one classic chart figure, gives its textbook definition, and shows it drawn on a real stretch of price history from this site's own records for gold, currency pairs and the Nifty 50. You will see which parts of the pattern are judgement, and the honest limit: a figure describes what price has already done and does not predict what it will do next.
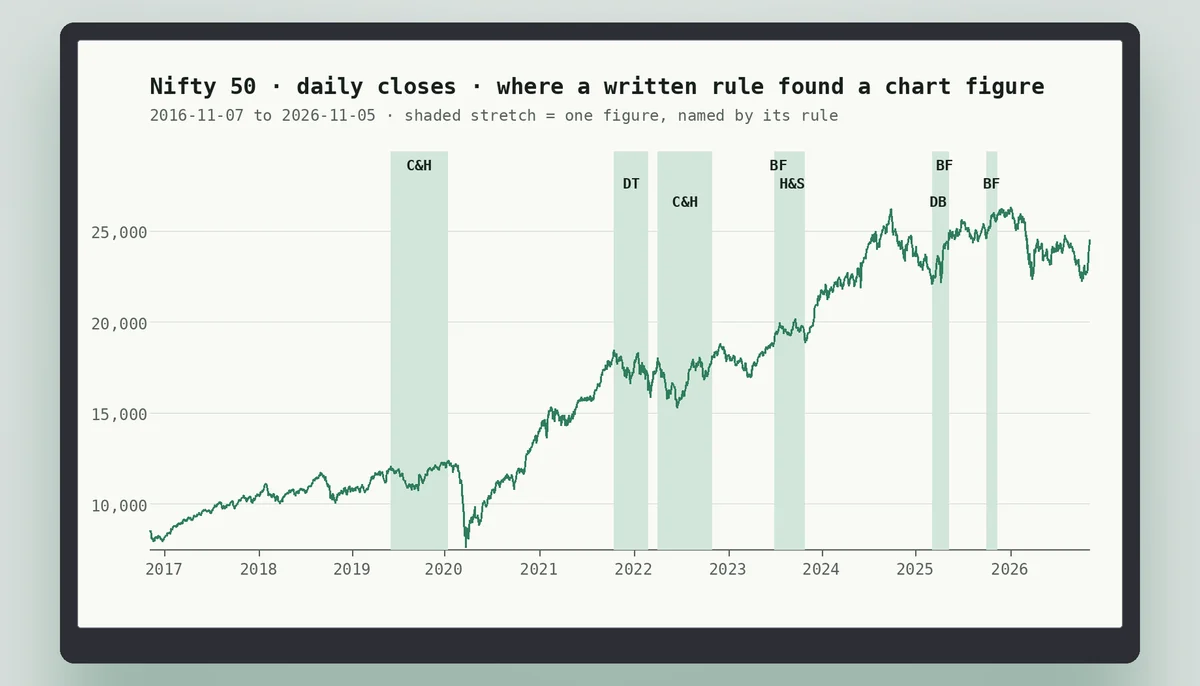
Six figures, each found on real price history
Each card is the stretch of real daily prices in which a written rule found that figure, drawn from the history this site keeps for Nifty 50, US dollar in Indian rupees, Gold (COMEX futures), Euro in US dollars. Open a card for the full chart, the rule and the definition.
- Head and shouldersNifty 50 · 22 Jun – 16 Nov 2023
- Double topGold (COMEX futures) · 22 Mar – 27 Jul 2017
- Double bottomNifty 50 · 13 Feb – 6 May 2025
- Ascending triangleUS dollar in Indian rupees · 27 Jan – 31 May 2022
- Bull flagGold (COMEX futures) · 20 Sep – 28 Nov 2023
- Cup and handleNifty 50 · 1 Feb – 21 Dec 2022
How to read one of the six figure pages
Each figure page opens with a chart drawn from real daily candles, placed directly under the heading, so the evidence comes before the explanation. A candle that closes above its open is drawn hollow and a candle that closes below its open is filled, so the two can be told apart even in a black-and-white print. The pale green band is the span of the figure, the dashed lines are the lines the definition uses (a neckline, a flat top, a rising base, a rim), the dotted vertical line is the session on which the figure was completed, and every labelled circle is a point the rule used.
Under the chart sits a caption that names the instrument, the period, the rule that found the figure and the source of the prices, with the date the history was read. Below the caption a short panel prints the rule itself, in words, so a reader can check the chart against it. The text that follows gives the textbook definition, the parts of it that are judgement, how the figure fails, and the limits of its measured move.
Nothing on these pages is a signal. The chart is a record of something that already happened, found by a rule that was written before the search. Reading it is practice at seeing a definition on a messy real chart, not a forecast.
What a figure found by a written rule means
A pattern is easy to see after the fact and easy to disagree about while it forms. To keep the atlas honest, no figure on it was placed by hand. A program applies a written rule to the stored daily candles, and only a stretch that satisfies every clause of the rule is drawn. The rule is the same for the Nifty 50, for gold and for the currency pairs, which is why its sizes are not in rupees or dollars but in multiples of the instrument's own typical daily move.
That typical move is the average true range over fourteen sessions, usually shortened to ATR: the average distance price travels in a day, including any gap from the previous close. A swing high or swing low counts only after price has reversed from it by at least three times the ATR (two times for the rising lows of a triangle). A head and shoulders must be at least five ATR tall, a bull flag needs a pole of at least eight ATR, and a cup must be at least ten ATR deep. Because the yardstick moves with the instrument, a figure that is large for the euro and a figure that is large for the Nifty are judged by the same rule.
The exact wording for each figure is printed under its chart and kept in the code that finds it. Where a figure is judgement, such as how level two peaks must be, the tolerance is fixed before the search and is not adjusted to produce an example.
Why a figure counts only when a close completes it
A chart figure is a story with an ending. Three peaks and a line through the troughs is only a head and shoulders once price has gone through that line, and a pair of equal highs is only a double top once price has gone through the low between them. The rule therefore searches for the ending as well as the shape, and it insists on a close. A thin spike through a line during the session proves little; a session that finishes beyond the line means that buyers or sellers were still there when trading stopped.
The rule also limits how long the ending may take. A head and shoulders must break its neckline within thirty sessions of the right shoulder, a triangle must break within twenty-five sessions of its last touch, and a flag within three sessions of its last bar. A break that never comes is not recorded as a failed figure; the stretch simply does not qualify. A close that goes the wrong way first, for example above the head before the neckline gives way, disqualifies the stretch as well.
These conditions make the figures rarer, and rarity is part of the point. On ten years of daily bars for four instruments, most of the six figures turn up only once or twice. Looser definitions find them far more often, which is one reason two chartists rarely agree on a count.
The four instruments and how an example is chosen
The atlas keeps ten years of daily candles for four instruments: the Nifty 50, gold, the US dollar against the rupee and the euro against the US dollar. They were read once from the public price history of Yahoo Finance and stored by this site, and every chart is drawn from that stored copy; the caption of each chart carries the date the history was read. Gold is the COMEX futures price in US dollars, not a spot price.
The Nifty 50 and gold come with a real open, high, low and close for every session. The daily bars the source gives for the two currency pairs have almost no body between the open and the close, and a few percent of them print a high or a low inside the bar's own open and close; where that happens the bar is drawn widened to include both, and the caption says so. For that reason a currency pair is used for an example only when neither the Nifty 50 nor gold holds one.
When the rule finds a figure more than once, the example drawn is the cleanest of them by the rule's own measure of tidiness, such as how level the two peaks are, and never the one that went on to do best. The caption states how many separate occurrences the rule found, so one tidy example is not mistaken for the typical case.
Reversal figures and continuation figures
The six pages fall into two families. A head and shoulders, a double top and a double bottom are reversal figures: they describe a move that has stalled and then turned, and each is completed by a close through a level, the neckline or the middle of the figure. An ascending triangle, a bull flag and a cup and handle are continuation figures: they describe a pause inside a move, and they are completed when price leaves the pause in the direction the textbook expects.
The distinction is about the definition, not the outcome. A reversal figure can fail by turning back through its own breakout, and a continuation figure can break the wrong way, as the triangle page explains. In both families the textbook adds a measured move, a distance projected from the break, and in both the pages treat it as a way of describing scale and not as a target price.
For a reader who is new to the subject, the double top and the double bottom are the simplest to define, and the head and shoulders adds one more peak to hold in mind. The triangle, the flag and the cup ask more of your judgement about where the lines go, and that is where the sections on judgement matter most.
What a drawn figure leaves out
A chart figure leaves out most of what a trade needs. It does not say how large a position to take, where a stop would sit, what the spread and the overnight cost would be, or what the reader can afford to lose. It does not show volume: the atlas draws price only, and where a page discusses volume it is describing a textbook habit, not something visible on the chart above. Nor does it show the news, the policy decision or the results date that moved price on the day.
It also leaves out every stretch of history that looked like a figure for a while and never completed. Those stretches are not hidden for any bad reason; the rule has no way to count a figure that did not finish. The honest reading is that the examples show what a completed figure looks like on a real chart, with its untidiness, and say nothing about how often completed figures led anywhere useful.
What the numbers on a chart mean
The price axis uses the instrument's own unit: index points for the Nifty 50, US dollars per troy ounce for gold futures, rupees per dollar for the dollar-rupee pair and dollars per euro for the euro pair. Each chart's price axis is scaled to the stretch it shows and not to the whole history, so two charts side by side are not drawn on one scale and their heights cannot be compared.
The date axis shows four dates taken from the stretch on display, and the candles stand one per trading session, equally spaced. Weekends and market holidays leave no gap, which is why a month on the chart is not always the same width. The labelled points are placed by the rule at the actual high or low of the session it chose, and the breakout point sits on that session's close.
Where the broker page fits
The site links to one broker, FxPro, from the button in the header and from the call to action at the foot of each page. That link is an advertising relationship: if a reader opens an account, the site is paid. The broker page explains in plain words what the account is, what a contract for difference on gold, a currency pair or an index is and is not, and what to read before depositing. It is kept apart from the figure pages so that the definitions above are never mixed with a sales message.
A reader who only wants to learn to recognise the figures needs no account at all: every chart and every rule is on these pages. If a reader does open one, the order ticket on the platform asks for a size, a stop and a take profit, which are the decisions this atlas deliberately leaves out.
One page per pattern
- Head and shouldersThree peaks with the middle one highest, a neckline through the two troughs, and completion only when price closes through the neckline.
- Double topTwo peaks at about the same level with a trough between them, confirmed only when price breaks below that trough.
- Double bottomTwo lows at about the same level with a rally between them, confirmed when price breaks above that rally's high.
- Ascending triangleA flat resistance line above and rising lows below, converging; the textbook reads it as a continuation with a break upward.
- Bull flagA sharp rise, a short shallow drift down or sideways, and the textbook expectation of a break back up.
- Cup and handleA rounded bottom, a return to the old high, a small pullback and then the textbook break of the rim.
The same chart, on a trading platform
A drawn pattern shows what price has done. An order needs a size, a stop and a take profit, and it is placed on a platform. This site links to an international broker whose platforms carry the same charts, with an order ticket that has its own fields for risk controls.